Logging Flask Applications on AWS Elastic Beanstalk with CloudWatch
2025-08-02
Outline
- What is Elastic Beanstalk?
- Initialize Flask application
- Deploy to Elastic Beanstalk
- Testing and Verification
Overview
This tutorial guides you through setting up centralized logging for a Flask web application deployed on AWS Elastic Beanstalk, with logs automatically streamed to Amazon CloudWatch. You'll learn how to configure structured logging in your Flask app, deploy it using Elastic Beanstalk's managed platform, and query your application logs using CloudWatch Logs Insights.
Prerequisites
- An AWS account
- Python 3.11 and above
- A code editor
- Estimated time: 30 minutes
What You'll Build
By the end of this tutorial, you'll have:
- A Flask web application with structured logging that captures user interactions and application events.
- An Elastic Beanstalk deployment that automatically scales and manages your application infrastructure.
- CloudWatch integration that streams your application logs in real-time to AWS's centralized logging service.
- Log querying capabilities using CloudWatch Logs Insights to search, filter, and analyze your application's behavior in production.
1. What is Elastic Beanstalk?
Based on the offical AWS document. Elastic Beanstalk is a service to easily migrate, deploy, and scale full-stack applications on AWS. It is a fully managed service, meaning it will handle underlying resources such as EC2 instance, database RDS, load balancer and more... There is no charge of service but you will have to pay for the resources that your application consumes.
This tutorial is focus on logging Flask application and query them on CloudWatch. For more additional information about Elastic Beanstalk. Please visit concepts in Elastic Beanstalk.
2. Initialize Flask application
Create an environment
$ mkdir logging
$ cd logging
$ python3 -m venv .venv
Activate the environment
$ source .venv/bin/activate
Install Flask
(.venv) $ pip install Flask
Initializing the App
(venv) $ mkdir app
The __init.py__ for the app package is going to contain the following code:
Thank you Miguel for an amazing tutorial.
app/__init__.py: Flask application instance
from flask import Flask
from logging.config import dictConfig

dictConfig(
    {
        "version": 1,
        "formatters": {
            "default": {
                "format": "[%(asctime)s] %(levelname)s in %(module)s: %(message)s",
            }
        },
        "handlers": {
            "wsgi": {
                "class": "logging.StreamHandler",
                "stream": "ext://flask.logging.wsgi_errors_stream",
                "formatter": "default",
            }
        },
        "root": {"level": "INFO", "handlers": ["wsgi"]},
    }
)

application = Flask(__name__)
from app import routes
For more information about logging. You can take a look at Flask logging and Python's logging.
app/routes.py: Home page route
from app import application
@application.route('/')
@application.route('/index')
def index():
application.logger.info("Hello user")
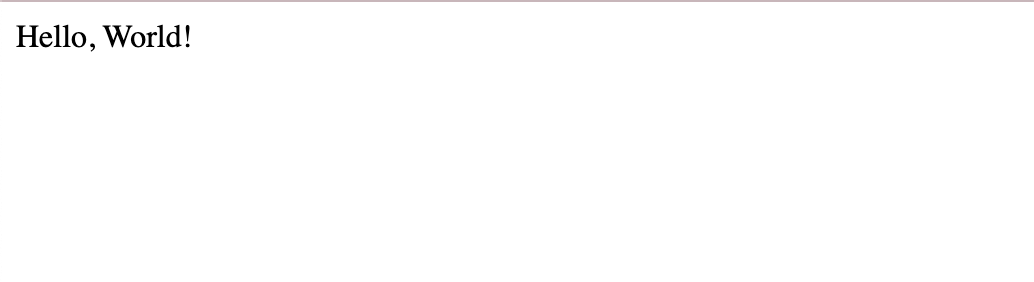
return "Hello, World!"
application.py: Main application module
from app import application
Now activate the Flask app by setting the FLASK_APP environment variable and test our app:
(.venv) $ export FLASK_APP=application.py
(.venv) $ flask run
The reason why named our main app is application.py and inside that we export an application variable is because Elastic Beanstalk is searching for the specific variable applicationinside application.py. You can read more at AWS's offical docs
If you can see a screen like this, then you're successfully setup the project.
One final step is to create a requirements.txt file to let Elastic Beanstalk knows which library to install
(.venv) pip freeze > requirements.txt
The initial structure is done.
Below is a diagram of the project structure so far
.
├── app
│   ├── __init__.py
│   └── routes.py
├── application.py
└── requirements.txt

2 directories, 4 files
Now let's zip the project by
zip -r flask.zip app/ requirements.txt application.py
3. Deploy to Elastic Beanstalk
Initialize Application
Go to Elastic Beanstalk -> Create application
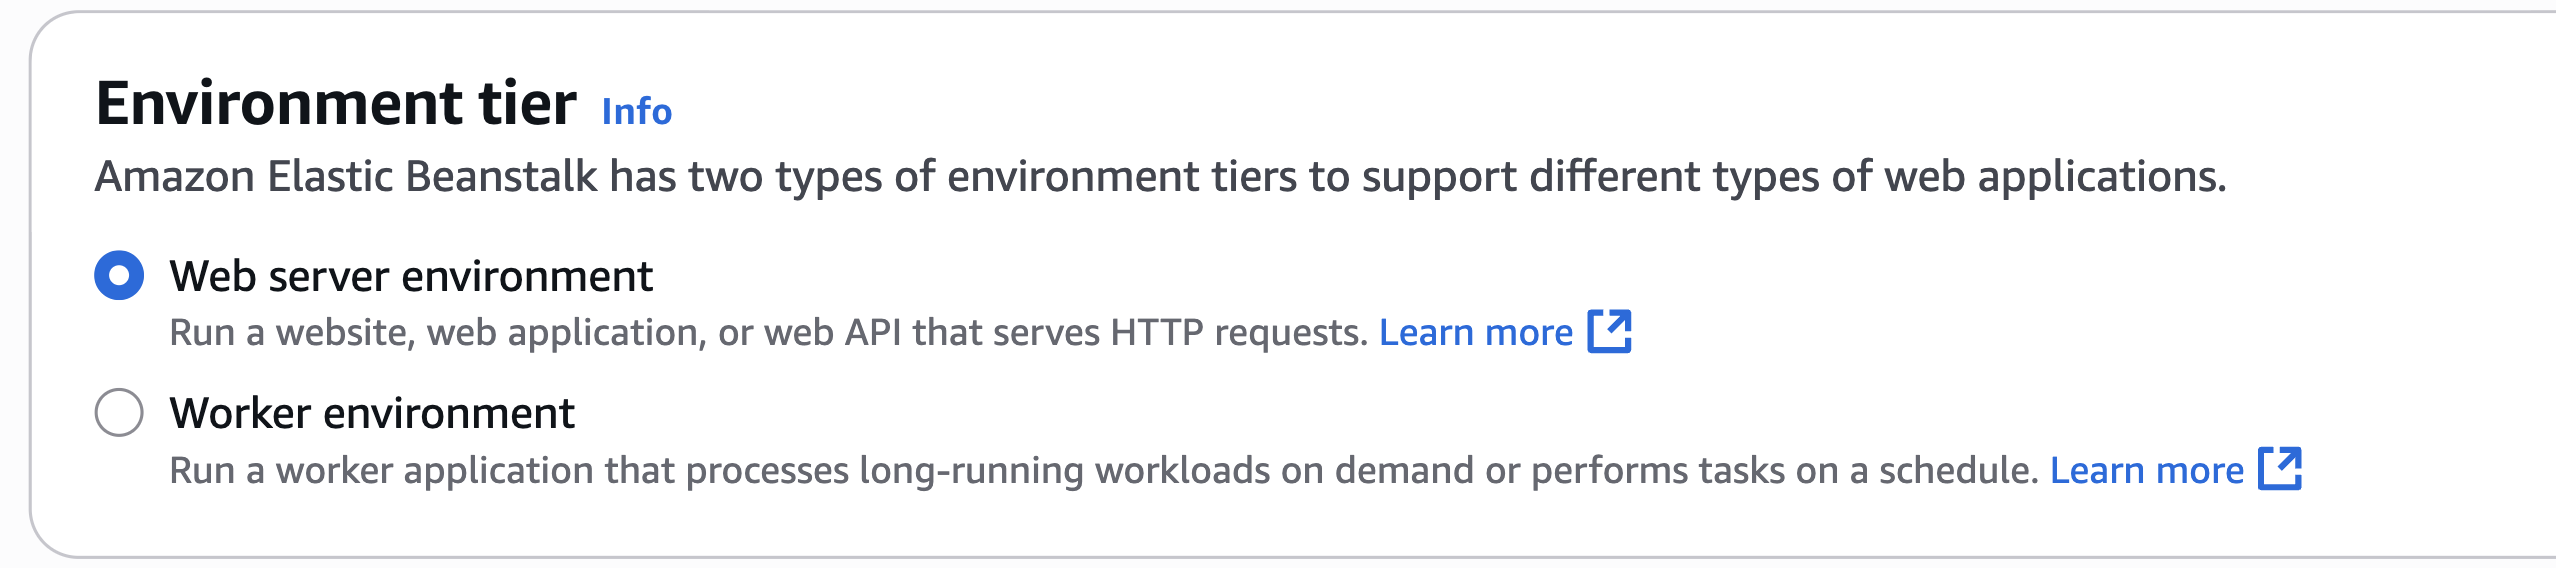
Environment tier
Choose Web server environment
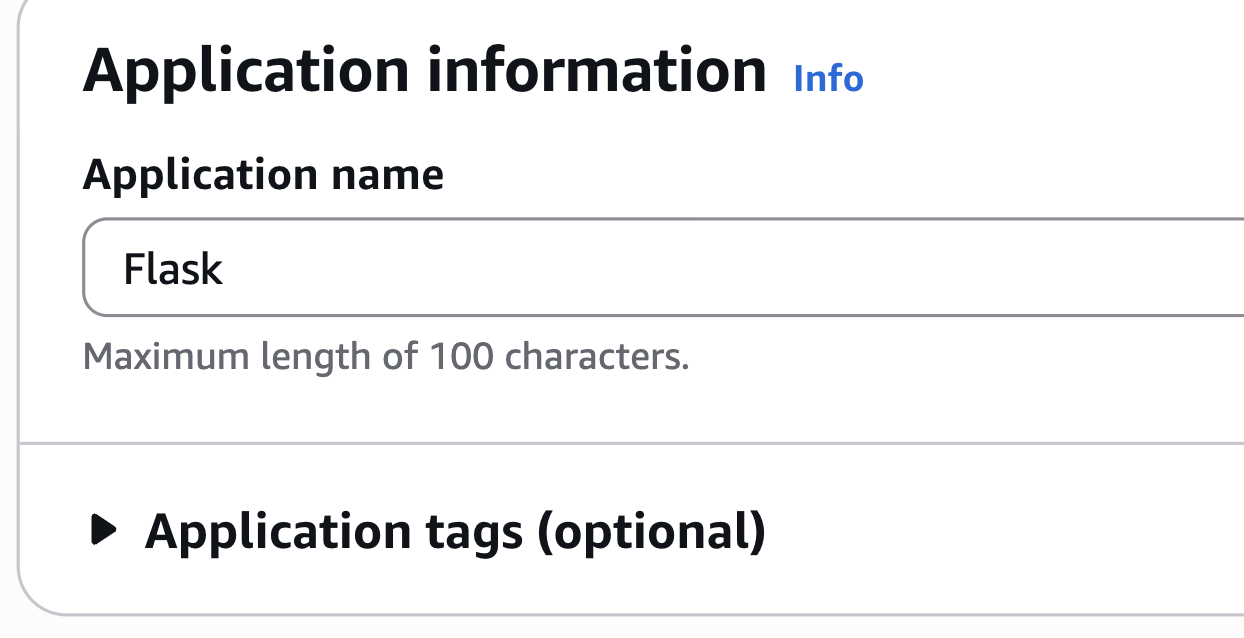
Application information
Enter your application name. I'll choose Flask
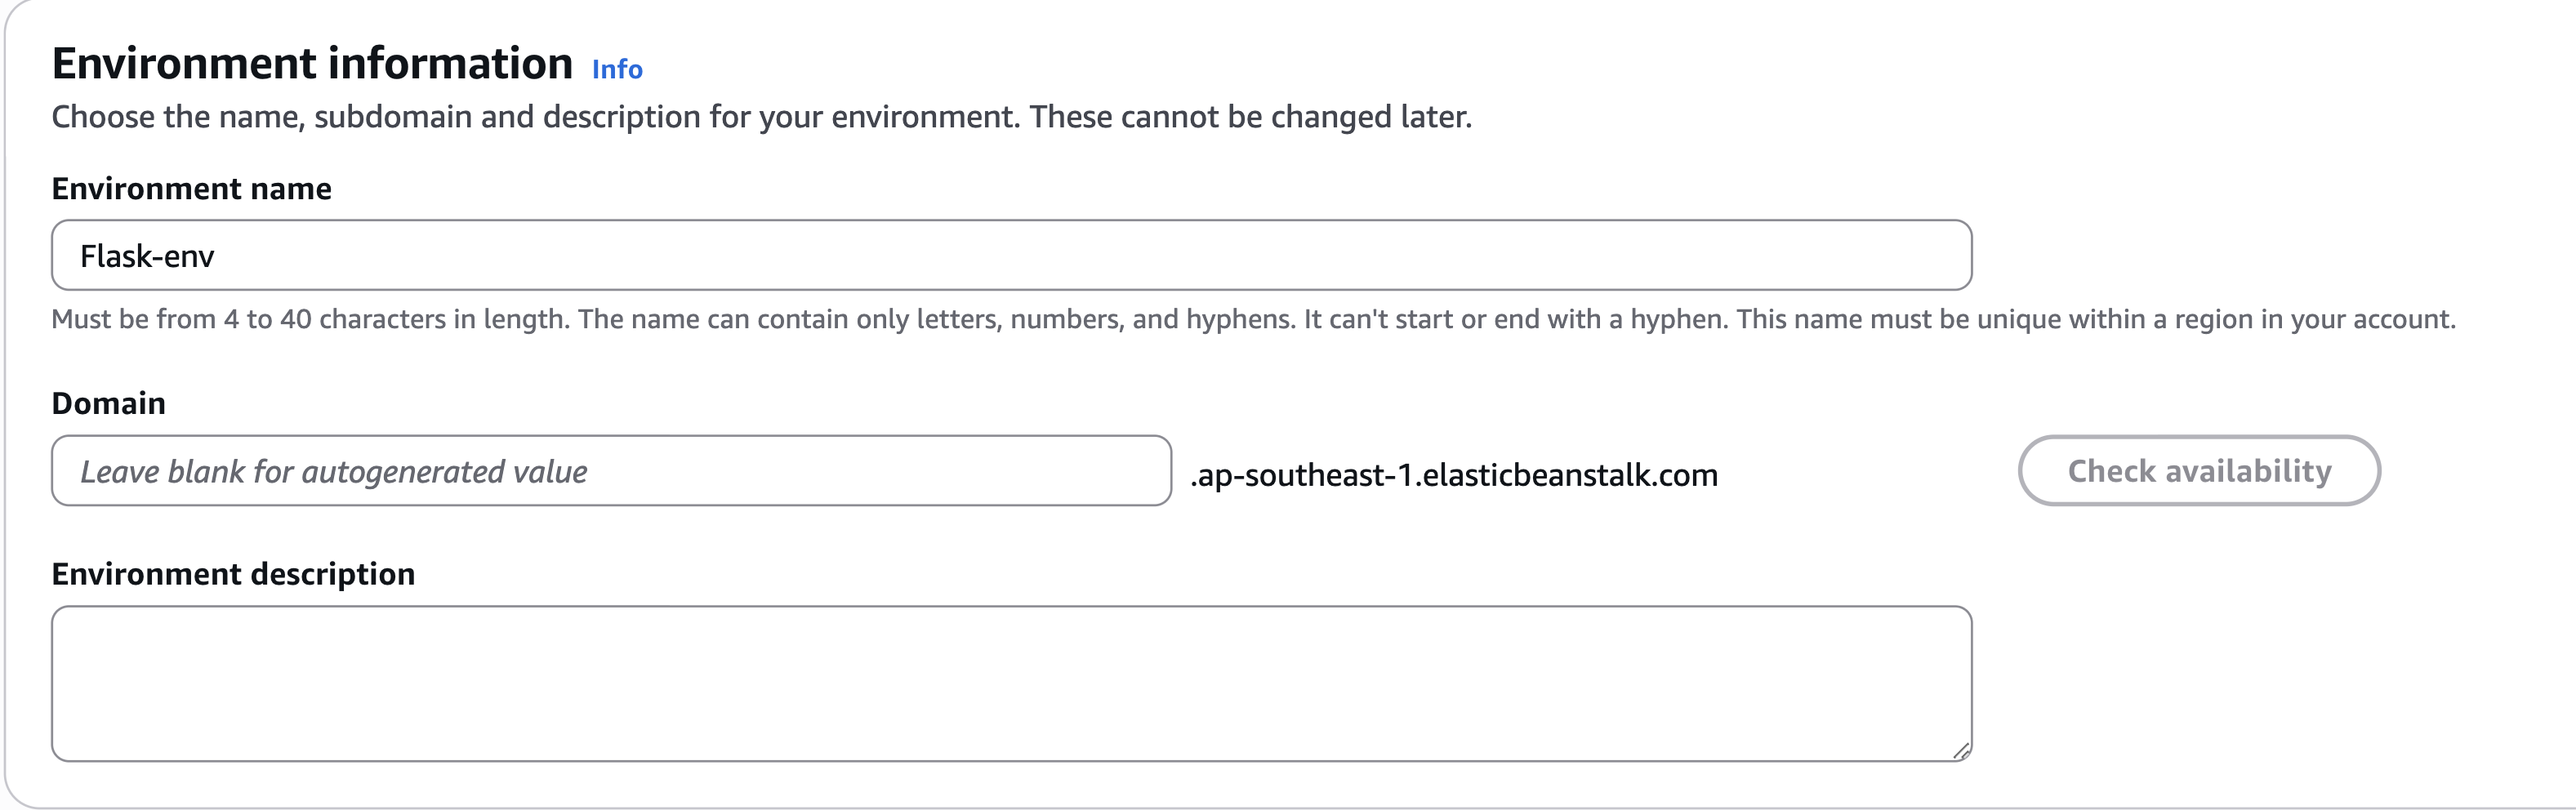
Environment information
Leave everything as default
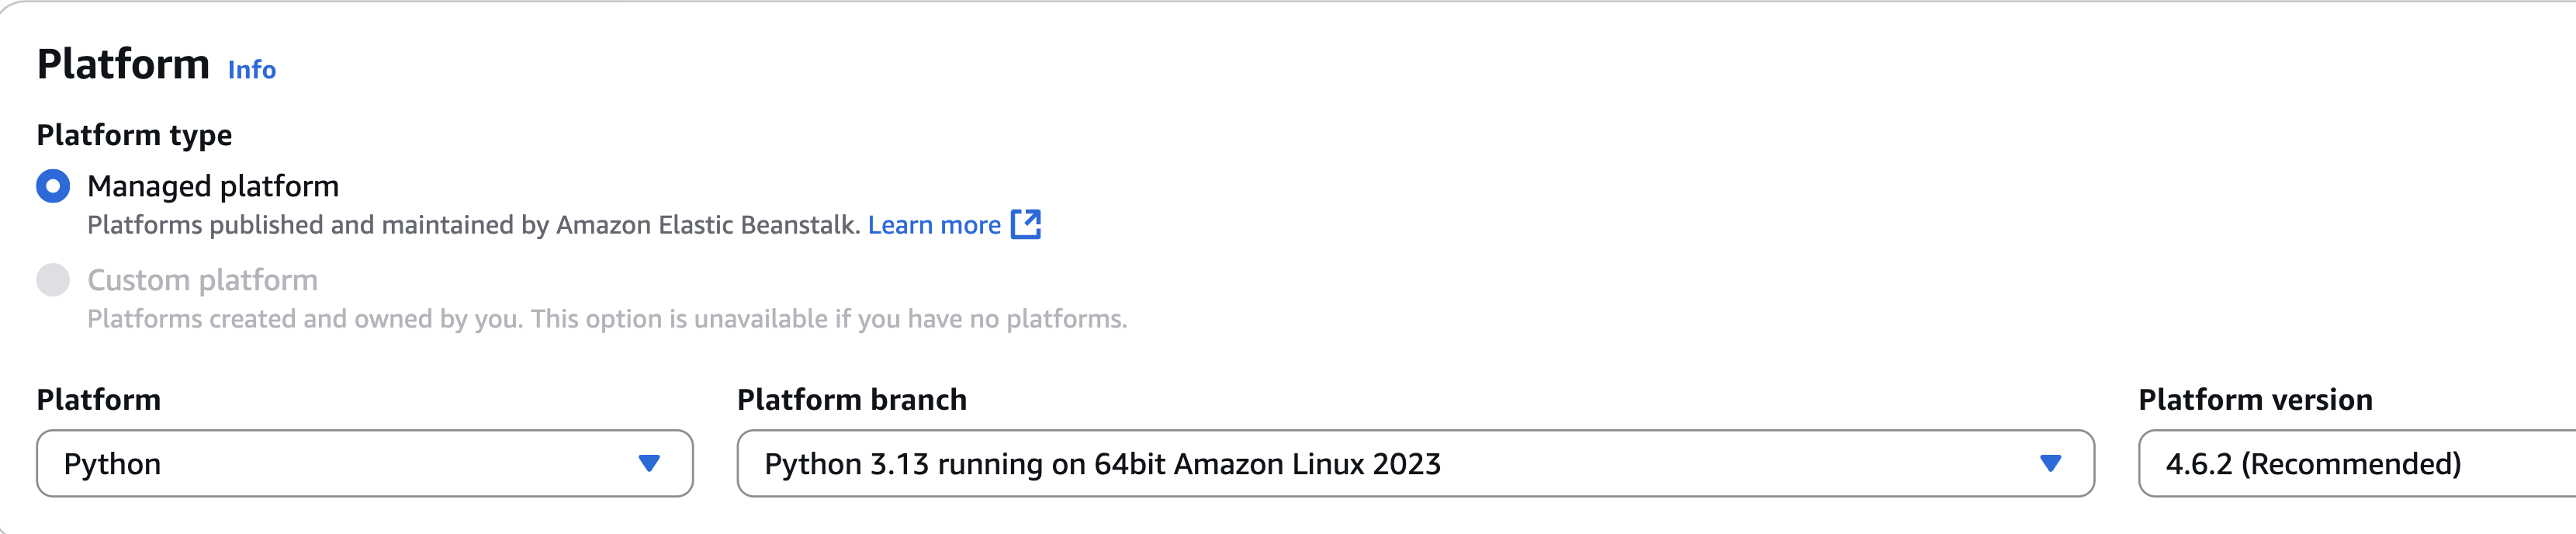
Platform
Select Managed platform and choose Python since we're using Flask
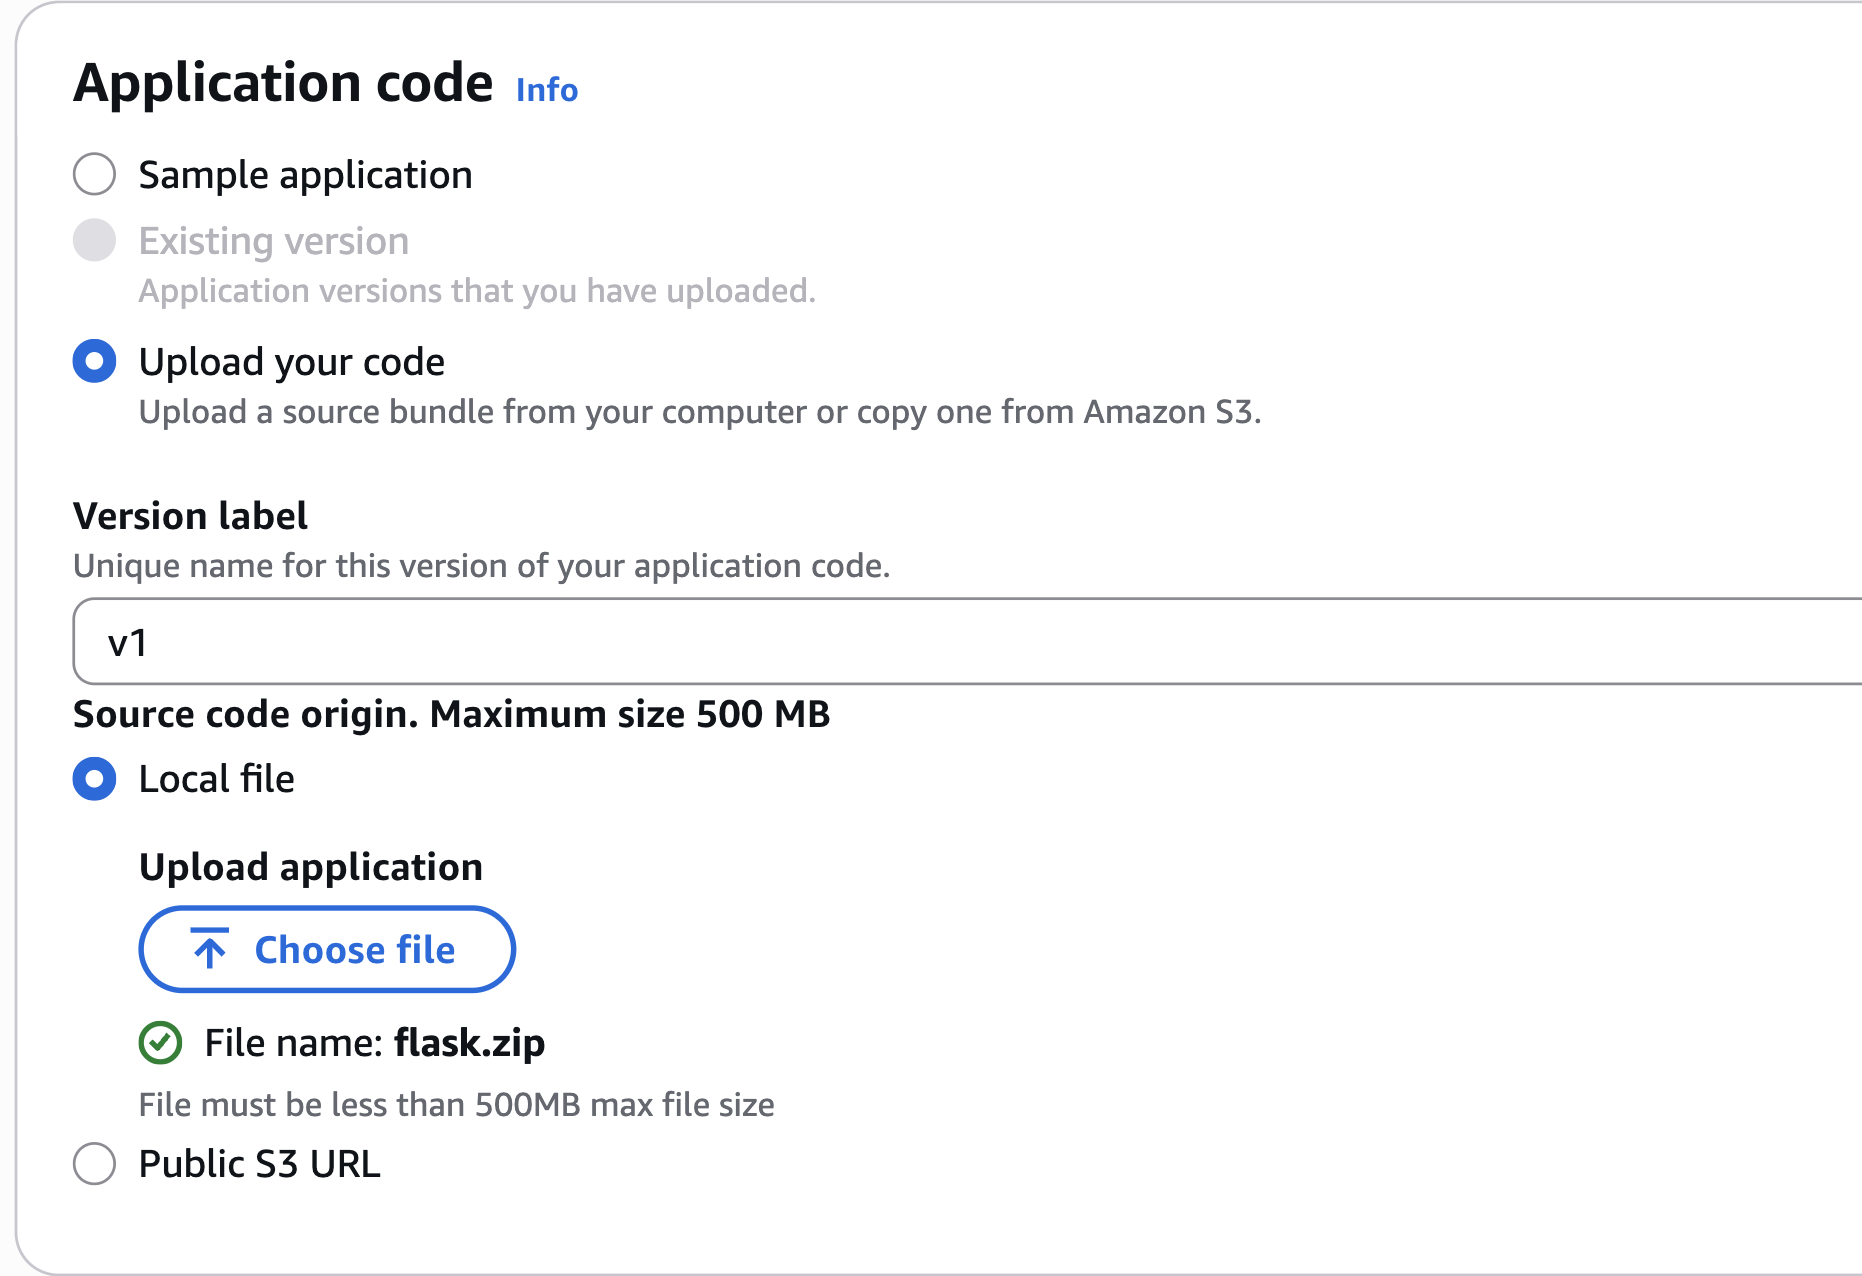
Application code
Choose Upload your code.
Version label I'll name it v1
Local file, choose the flask.zip file we archive earlier.
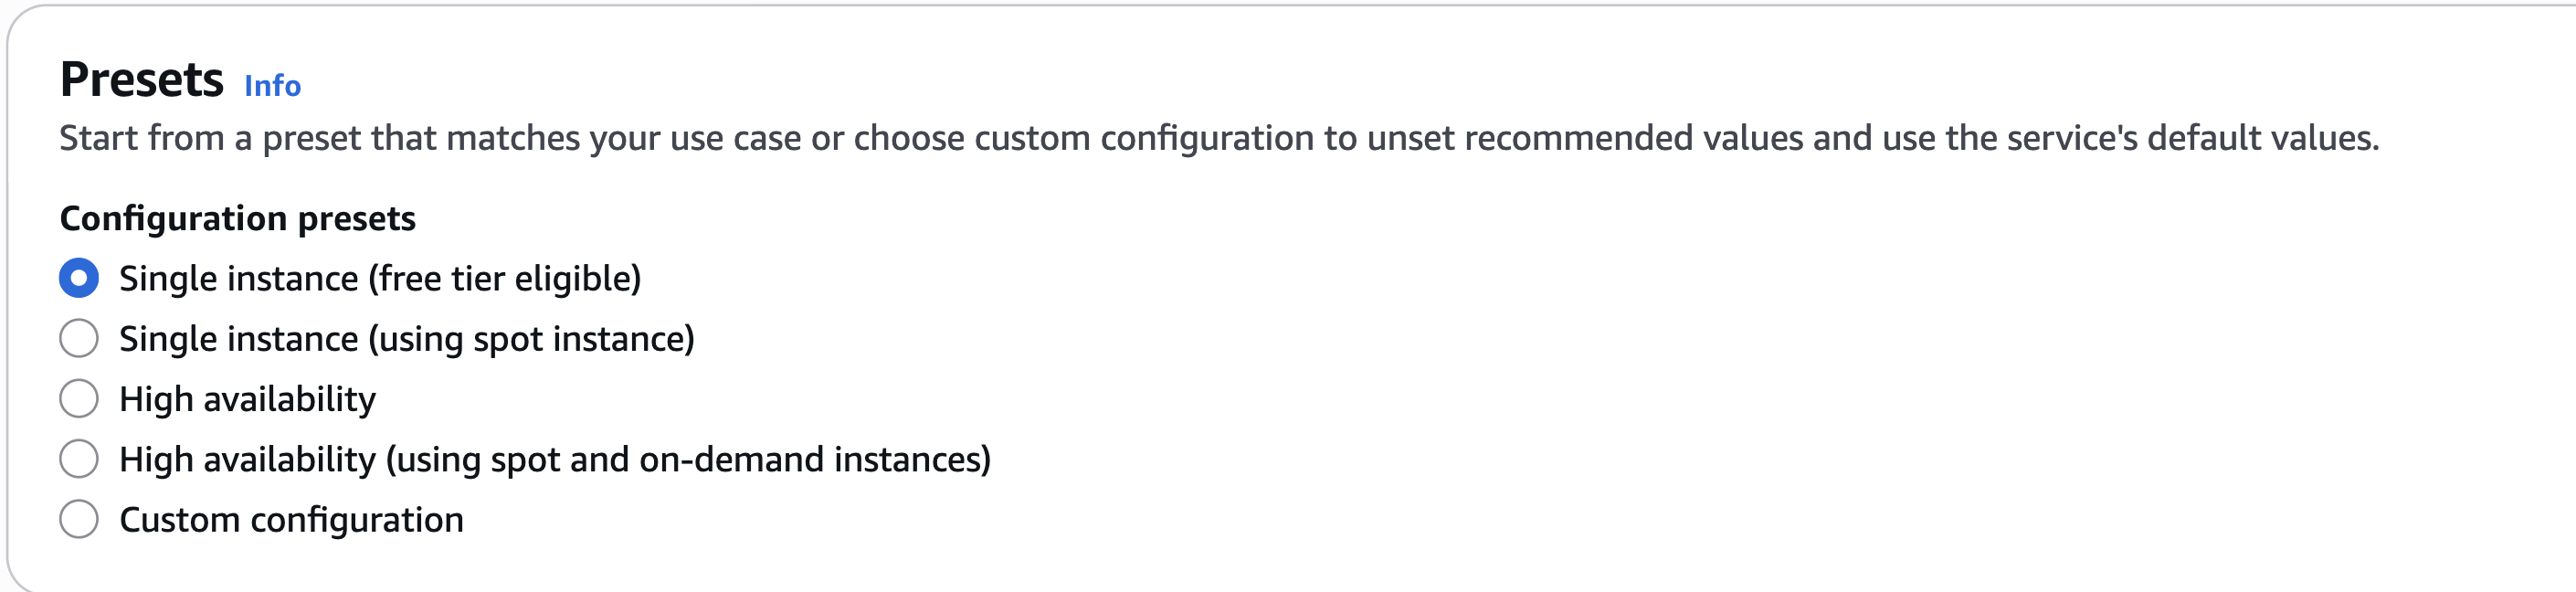
Presets
Choose Single instance (free tier eligible)
Configure Service Access
Use the default service role and EC2 instance profile that Elastic Beanstalk create for us.
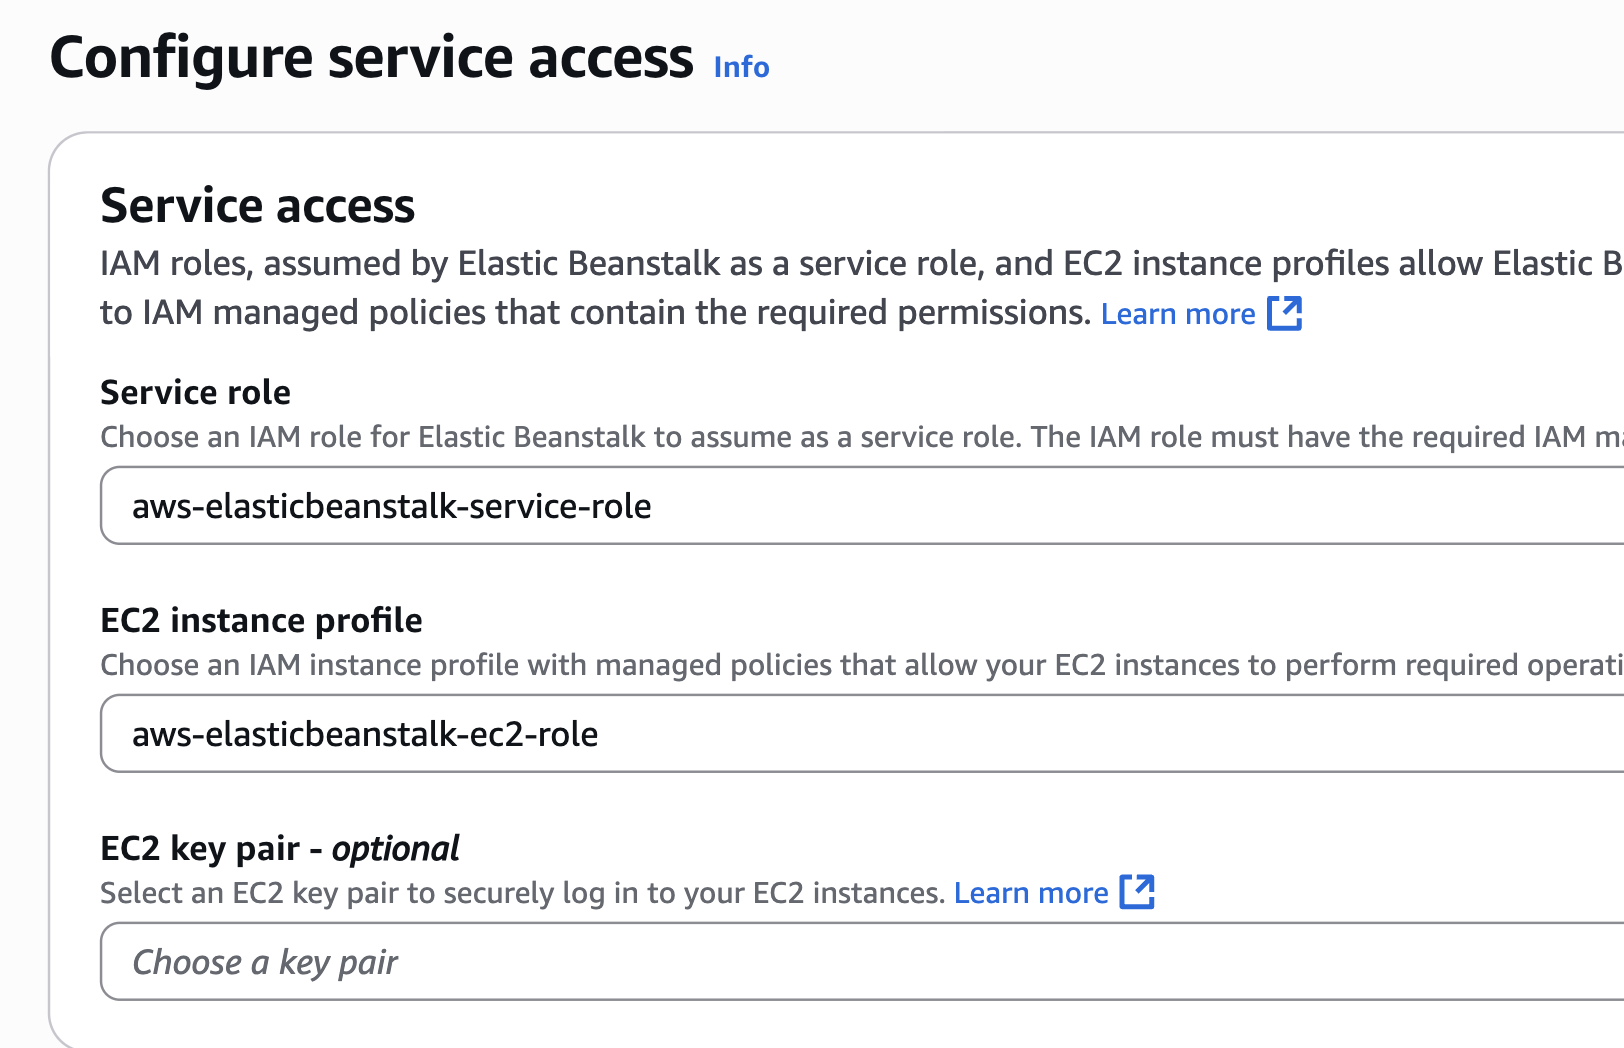
If you dont have one, you can create a new one by click on Create role on the right.
Setup networking
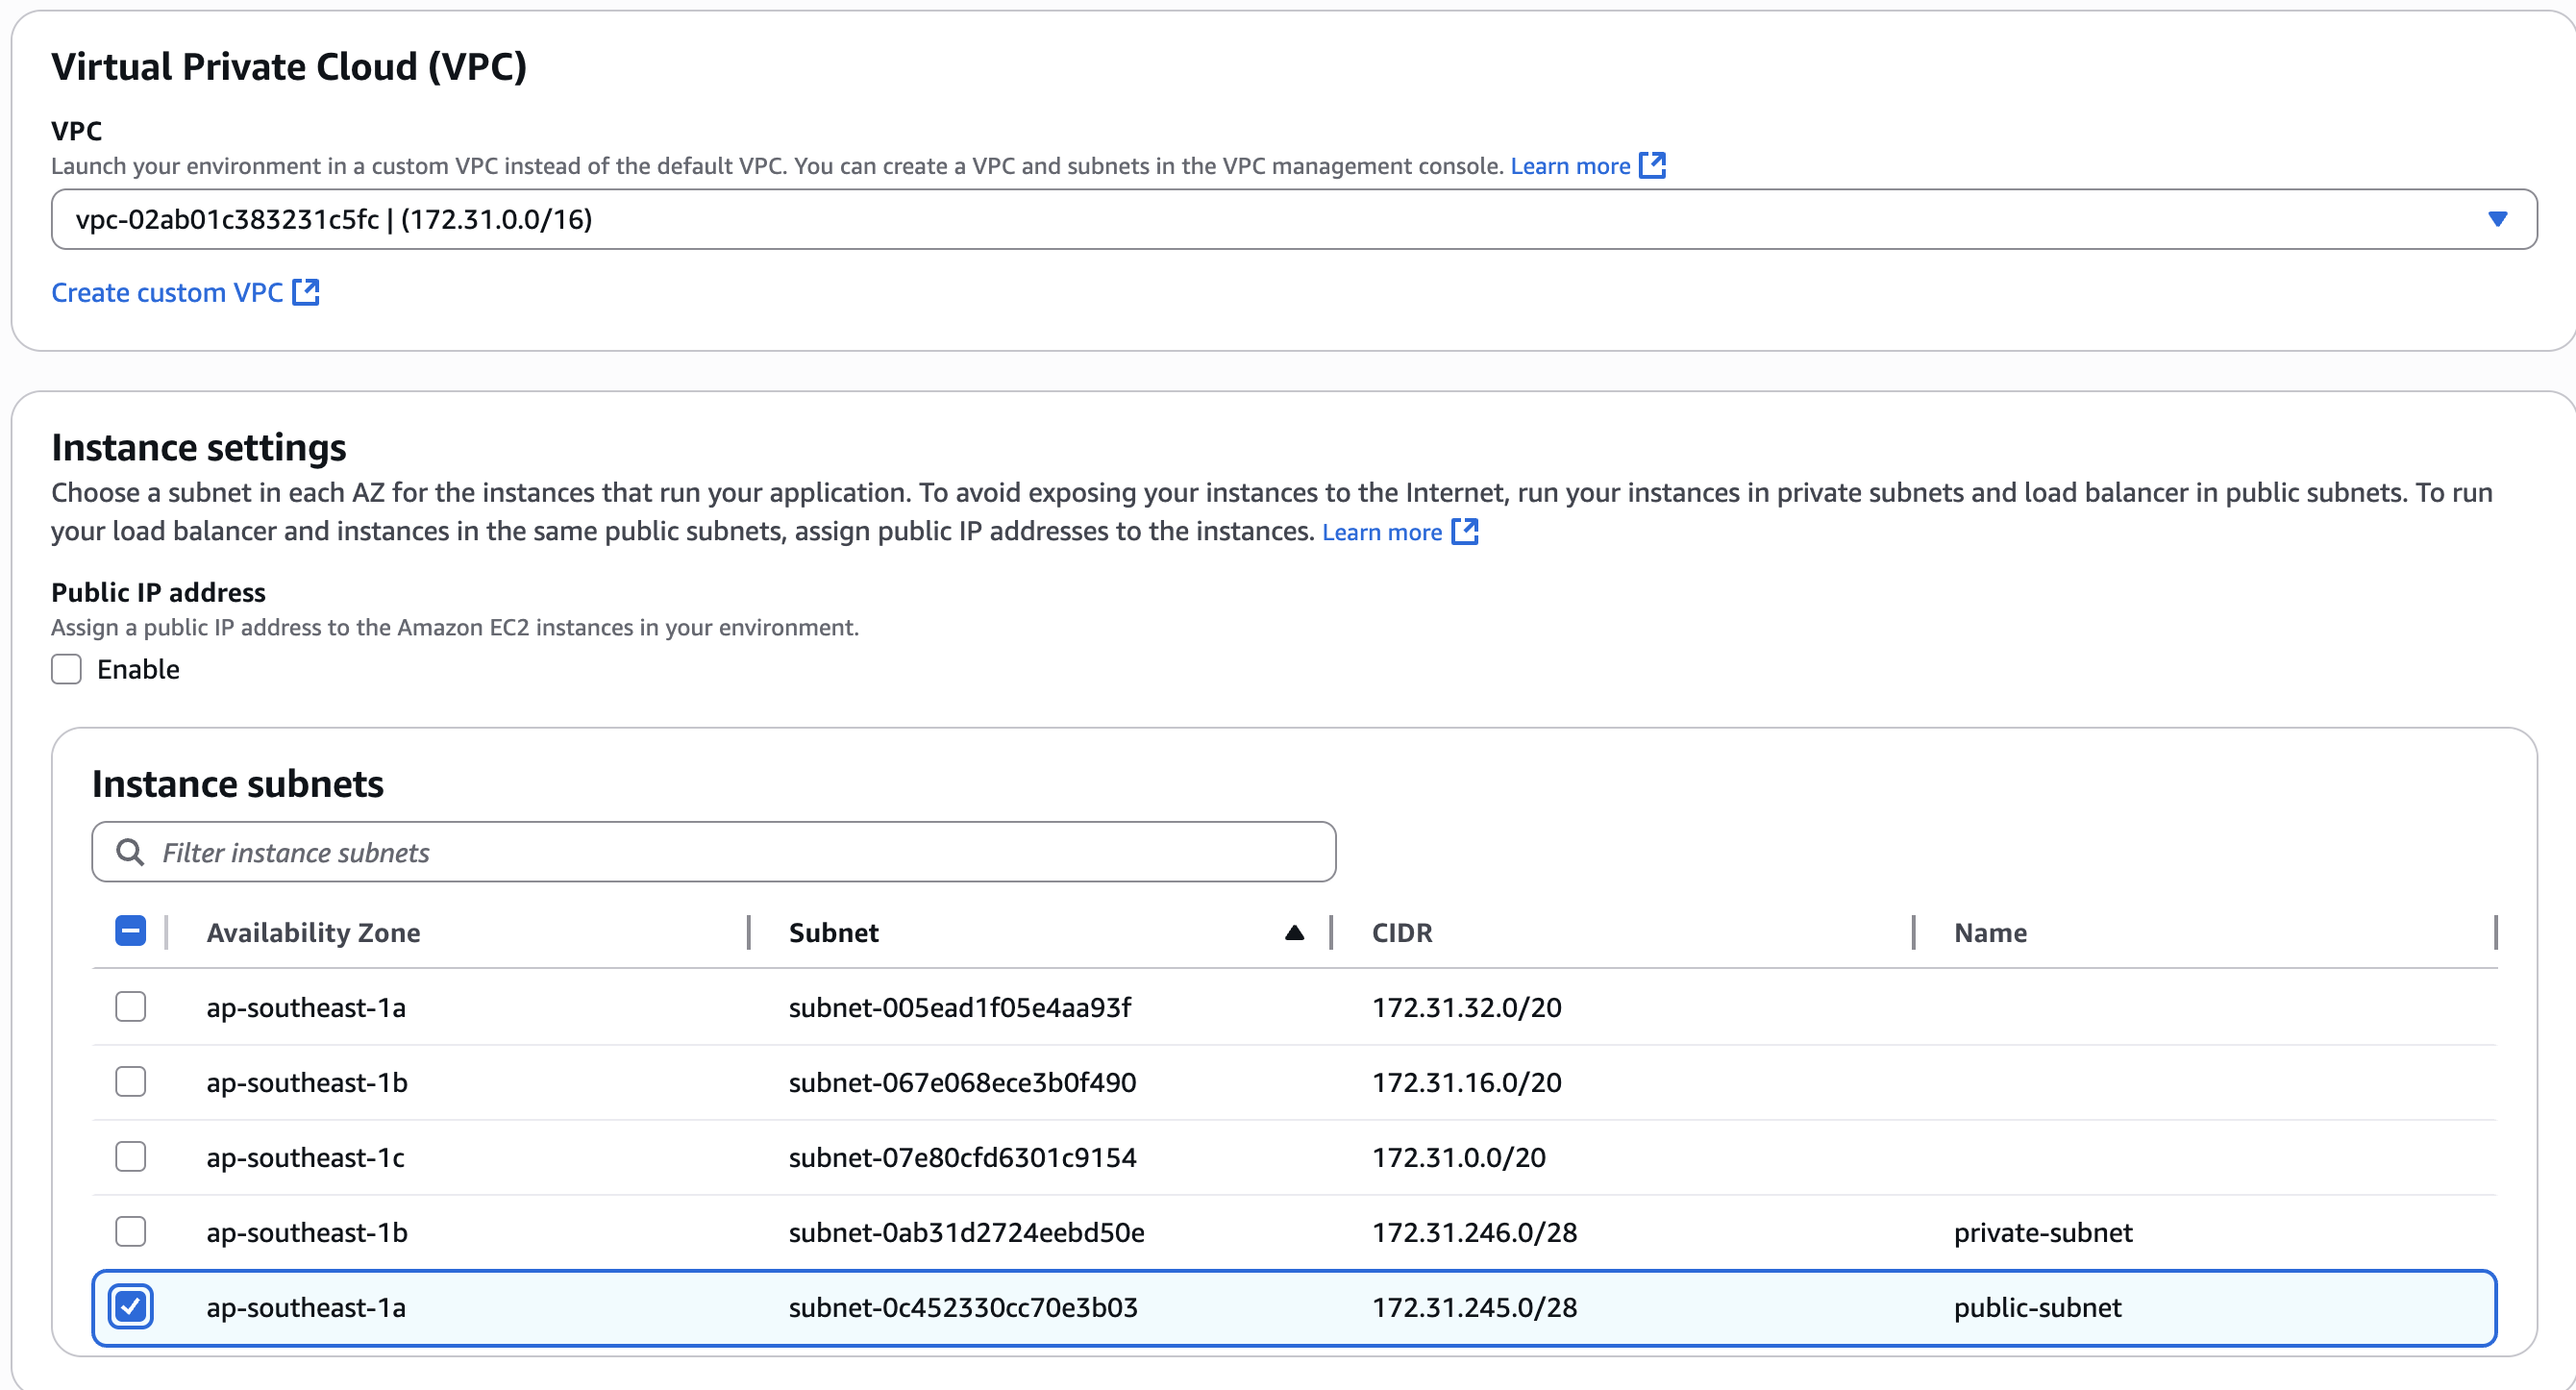
You can choose default VPC with any subnet you want.
Configure instance traffic and scaling
We can leave everything as default and click Next.
Configure updates, monitoring, and logging
At the bottom you will see Instance log streaming to CloudWatch logs. Be sure to click on Enable Log streaming. I will choose a retention of 1 day.
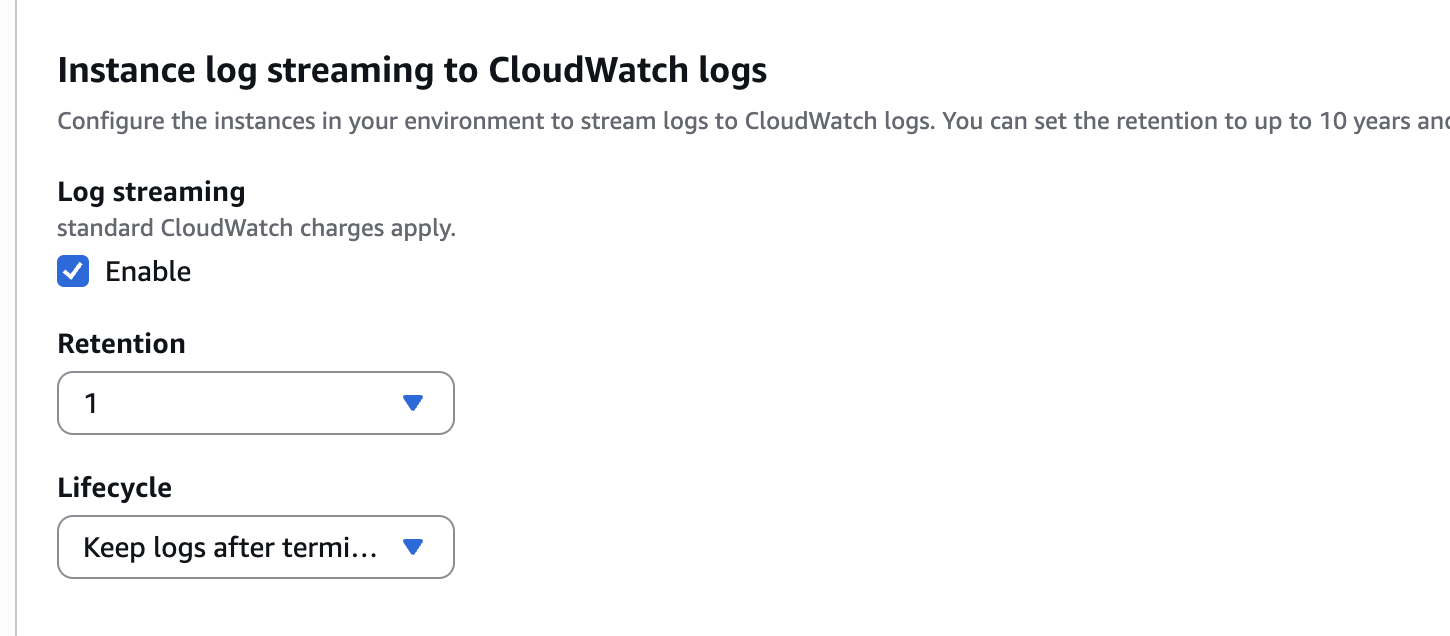
You can also choose whether you want to keep the logs after the environment is terminated.
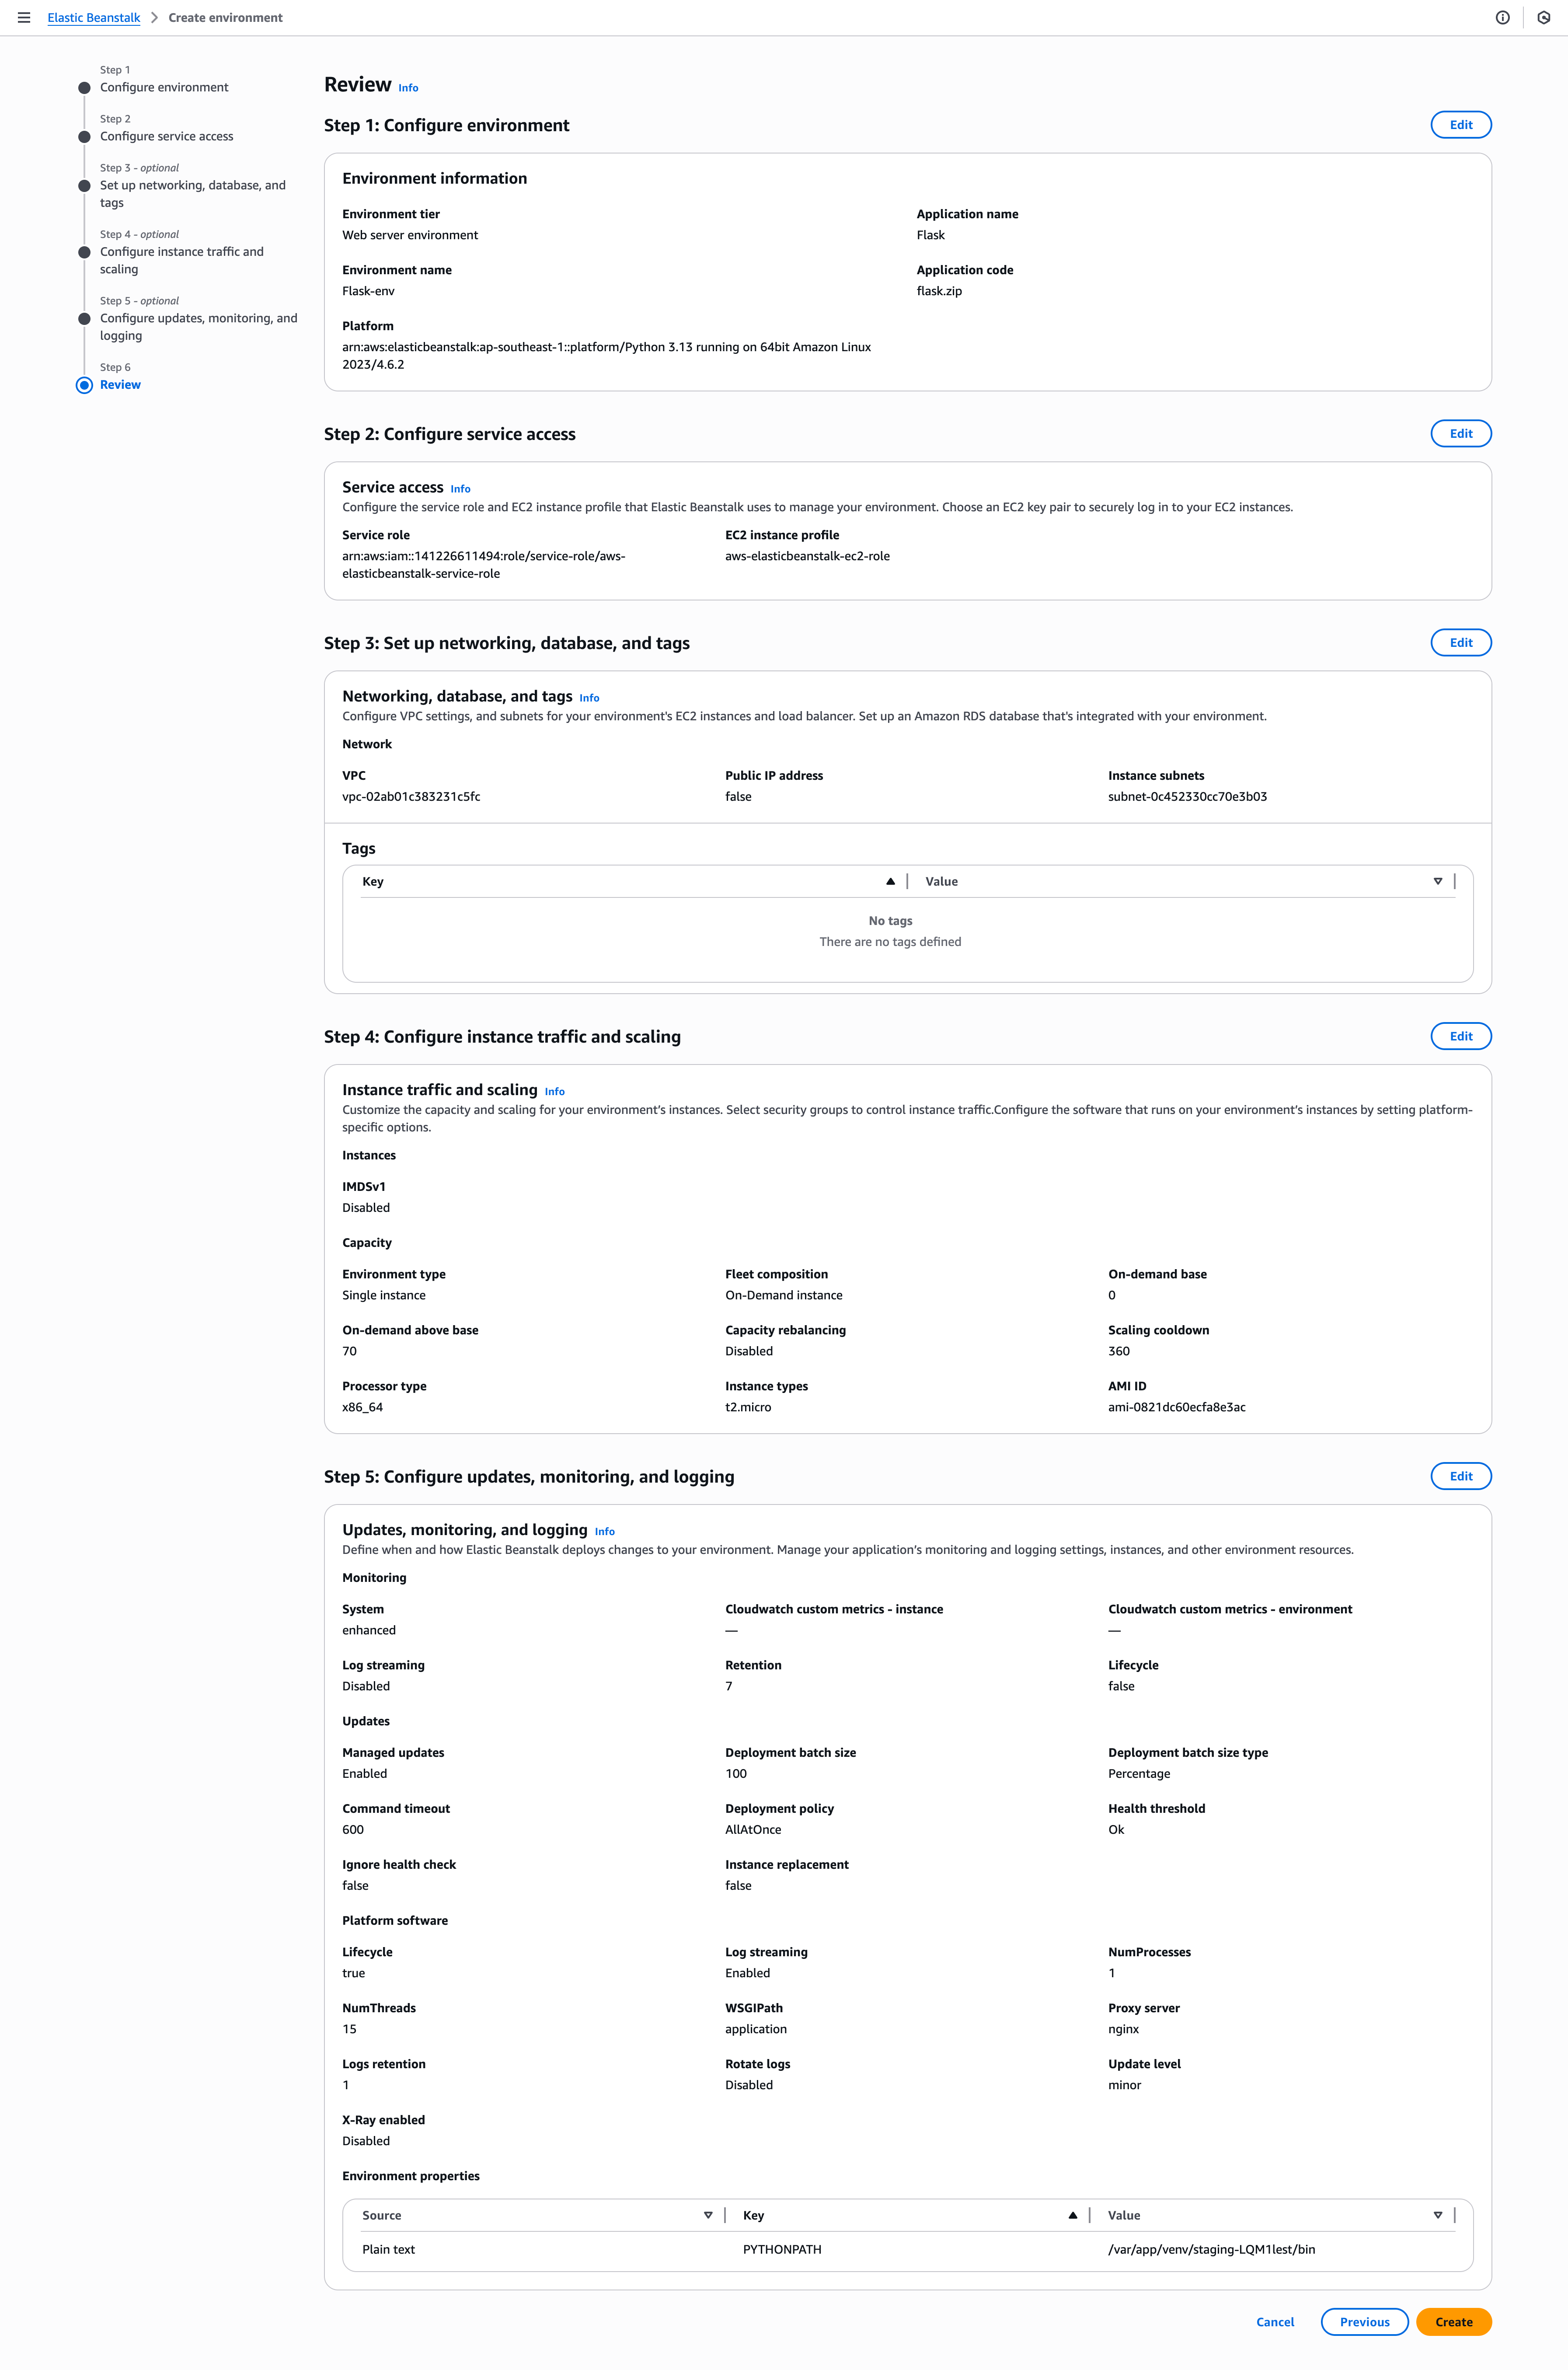
Review
Finally, review the configuration then click Create.
When the environment successfully launched we can check by pressing on the Domain Elastic Beanstalk gave us.
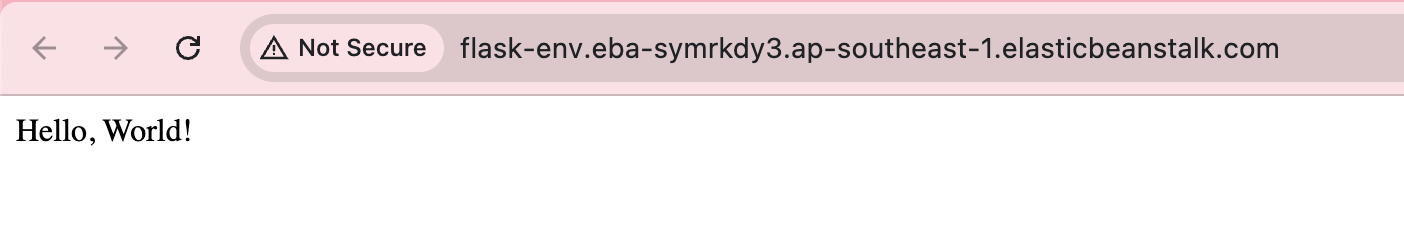
It is working!
4. Testing and Verification
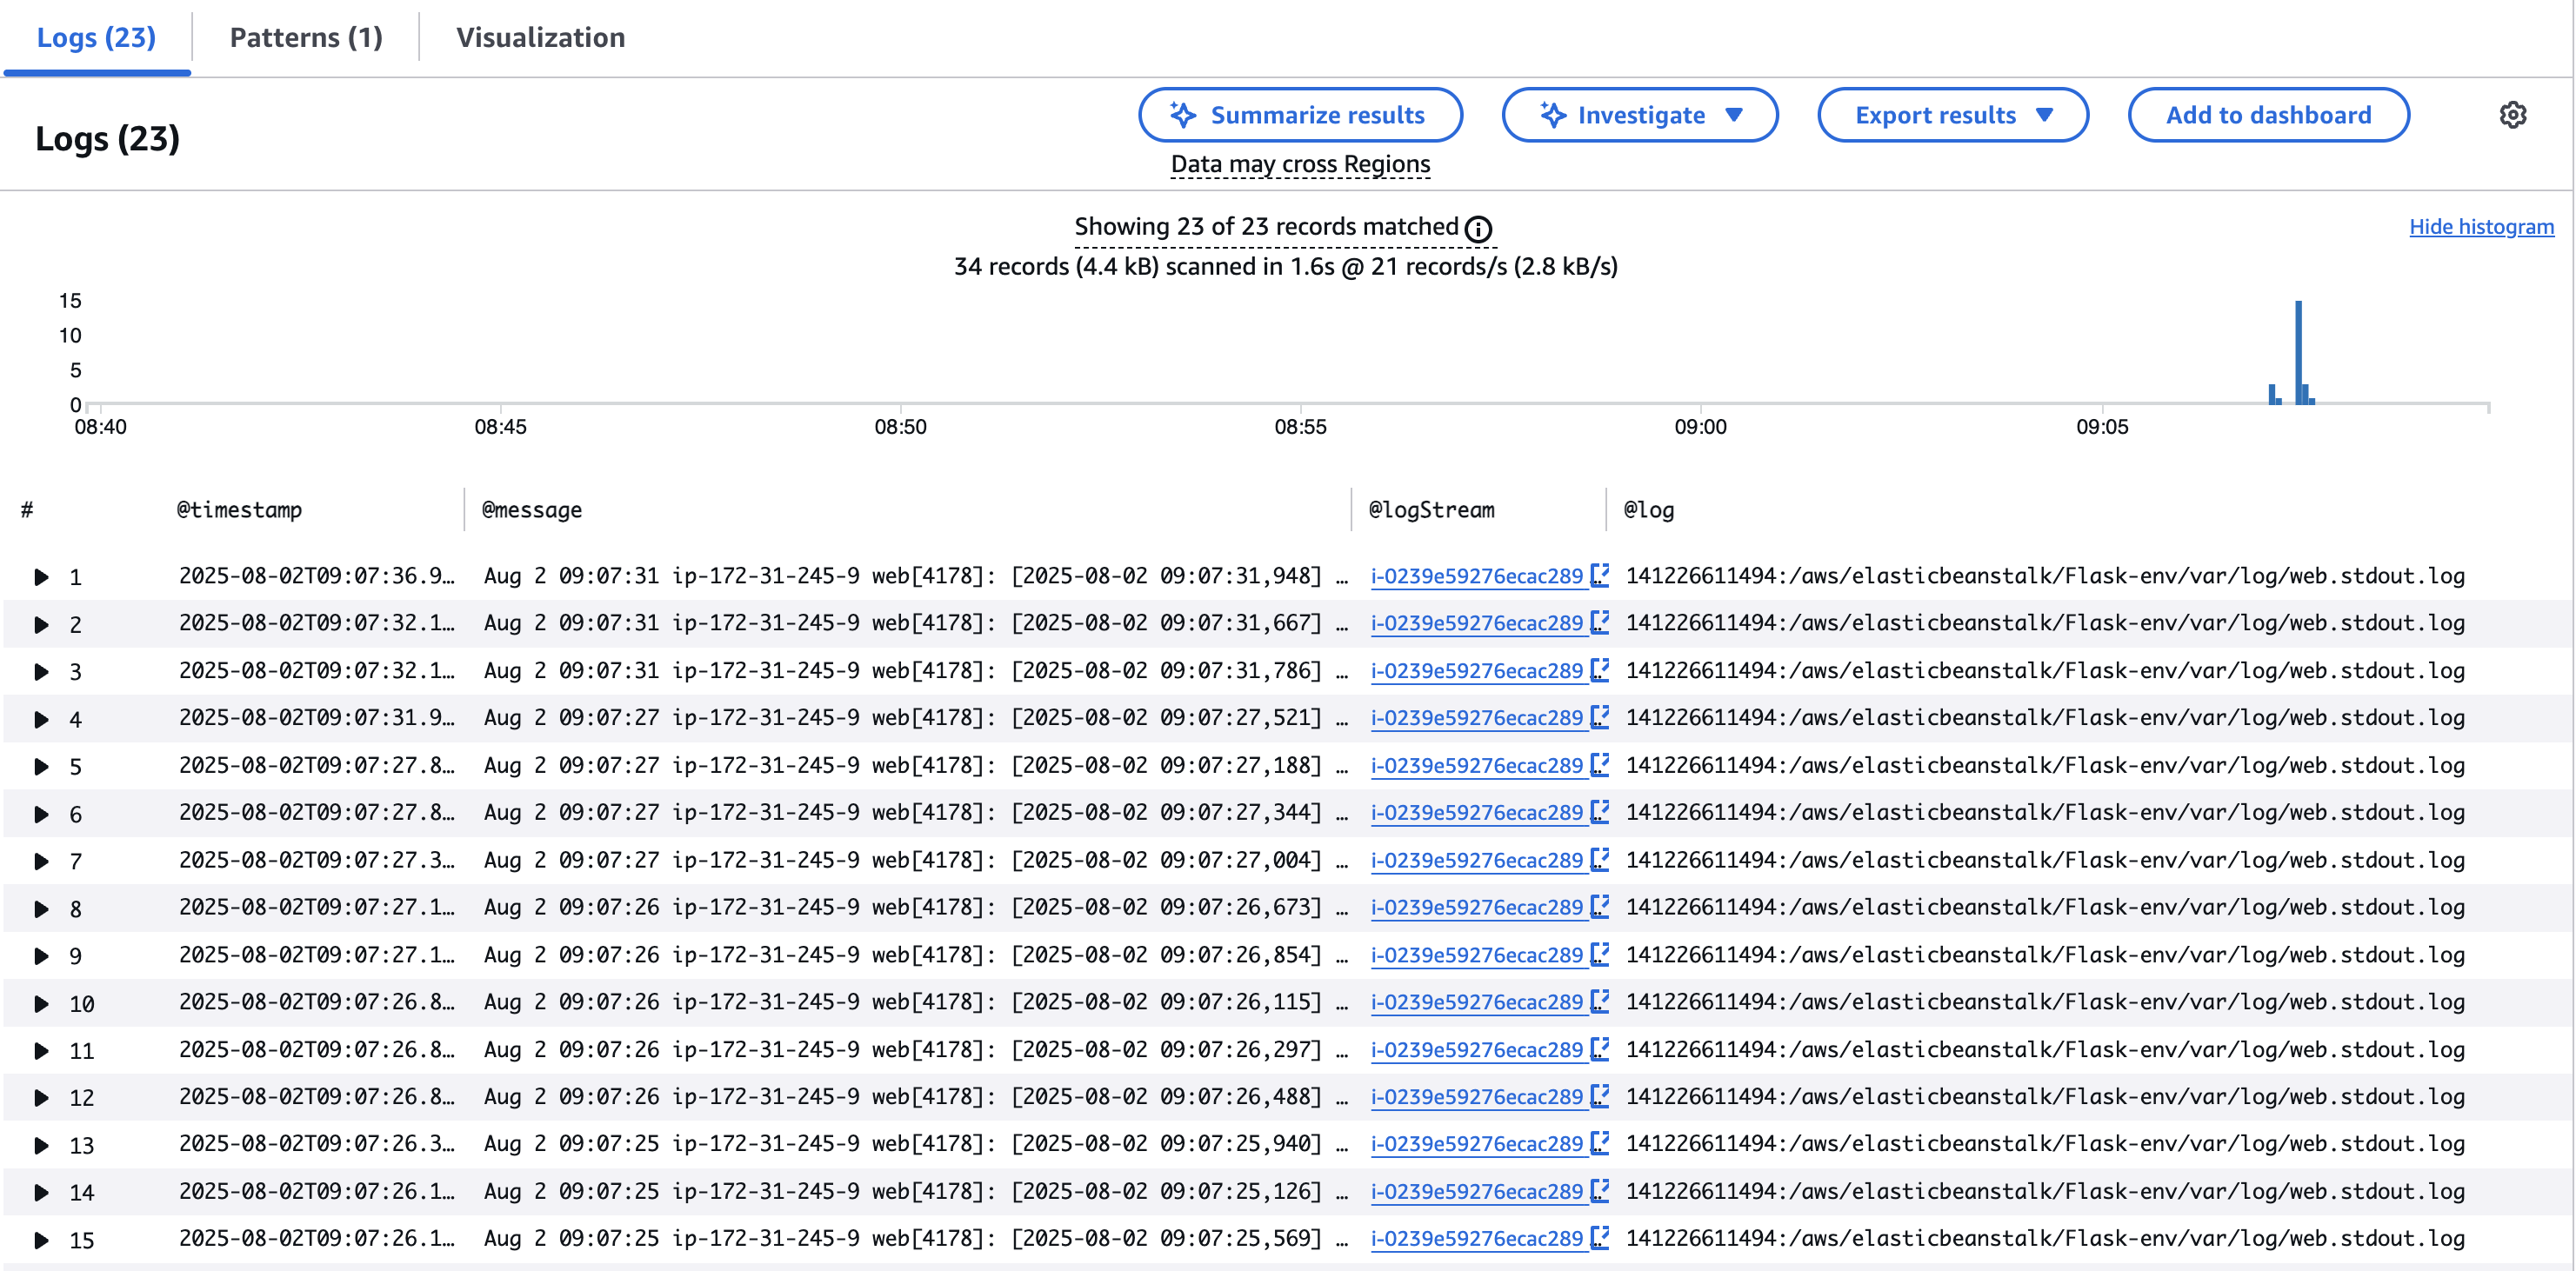
Now because in our routes we have a logging statement whether a user visit our main page. Let's check it in CloudWatch
application.logger.info("Hello user")
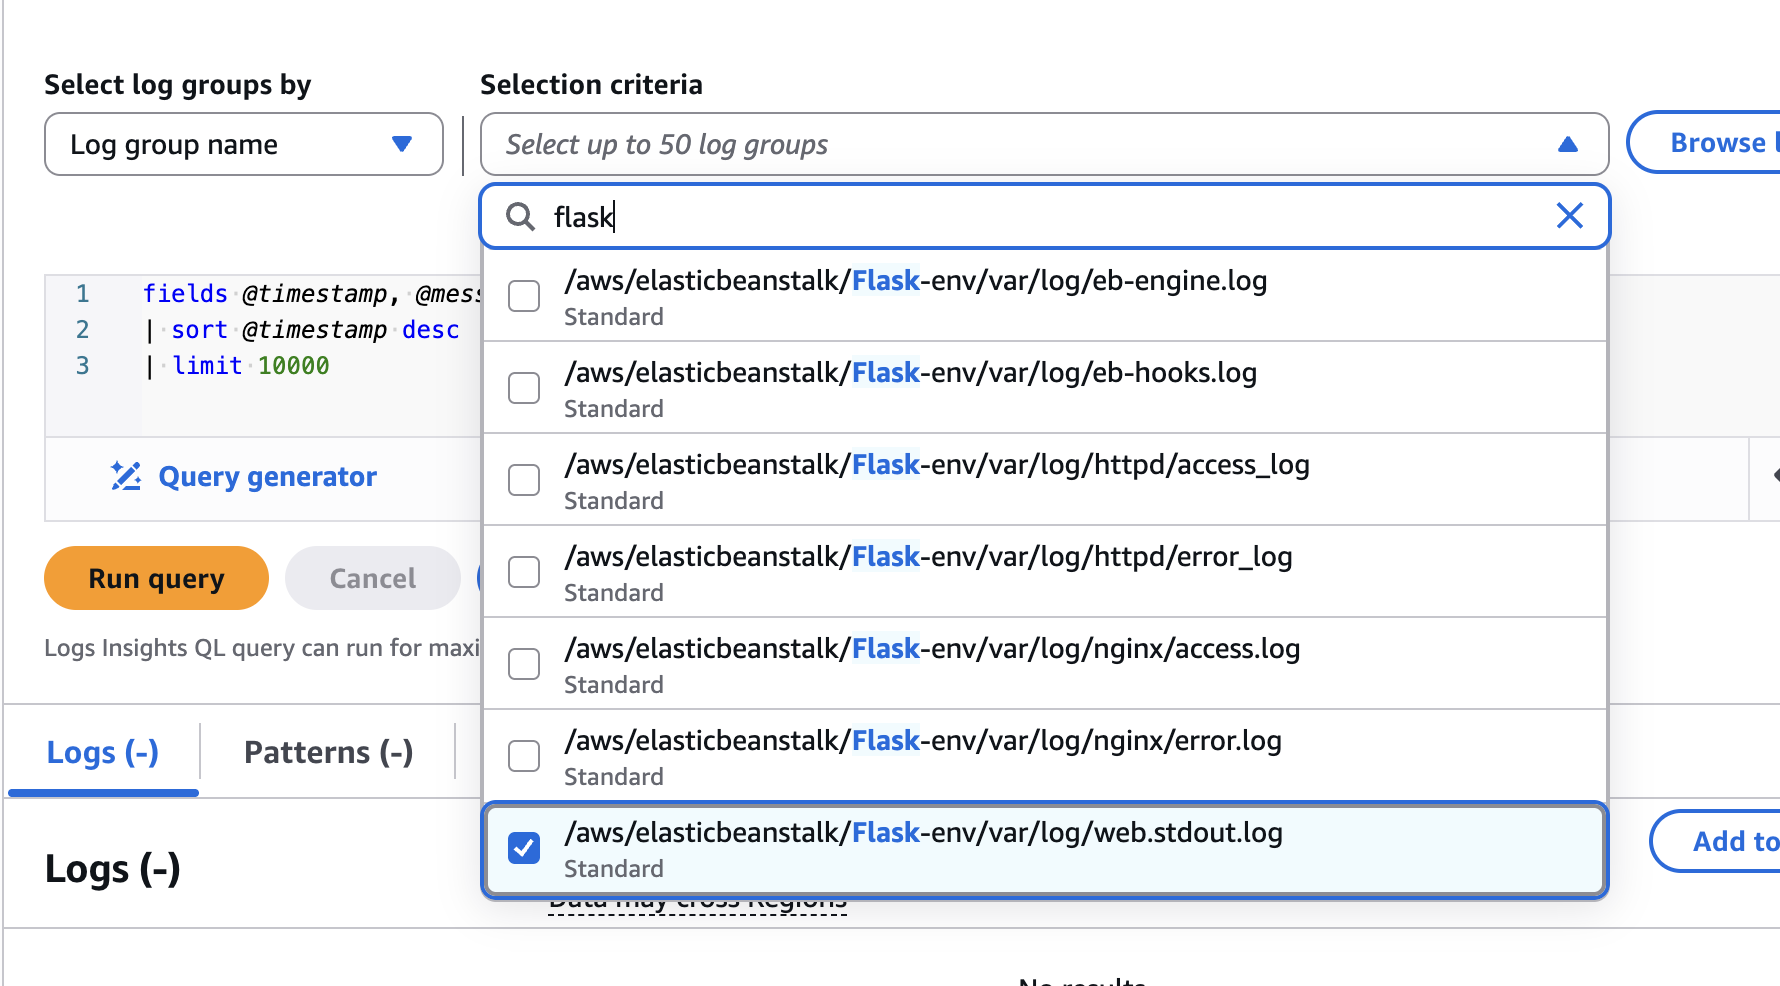
Go to CloudWatch -> Logs -> Logs Insights. I will select the web.stdout.log group
The log have a specific string Hello. So I will query for that string.
I changed the query from
fields @timestamp, @message, @logStream, @log
| sort @timestamp desc
| limit 10000
to
fields @timestamp, @message, @logStream, @log
| filter @message like "Hello"
| sort @timestamp desc
| limit 10000
Troubleshooting
Application Deployment Issues
Problem: Deployment fails with "Your WSGIPath refers to a file that does not exist"
Solution:
- Ensure your main file is named
application.py(notapp.pyormain.py) - Verify the Flask app variable is named
applicationinsideapplication.py - Check that
application.pyis in the root of your zip file, not inside a subdirectory
# Correct zip structure:
zip -r flask.zip app/ requirements.txt application.py

# Incorrect - creates extra directory:
zip -r flask.zip logging/
Problem: "ModuleNotFoundError" during deployment
Solution:
- Ensure
requirements.txtincludes all dependencies:
(.venv) $ pip freeze > requirements.txt
- Verify Flask is listed in requirements.txt with the correct version
- Check for typos in package names
Problem: Application shows "502 Bad Gateway" after deployment
Solution:
- Check your application logs in Elastic Beanstalk console under "Logs"
- Common causes:
- Syntax errors in Python code
- Import errors in
__init__.py - Port binding issues (let Elastic Beanstalk handle ports)
CloudWatch Logging Issues
Problem: No logs appearing in CloudWatch
Solution:
-
Verify log streaming is enabled in EB environment configuration:
- Go to Configuration → Software → Edit
- Check "Instance log streaming to CloudWatch logs" is enabled
-
Check IAM permissions:
- Ensure the
aws-elasticbeanstalk-ec2-rolehas CloudWatch logs permissions - Add this policy if missing:
- Ensure the
{
  "Version": "2012-10-17",
  "Statement": [
    {
      "Effect": "Allow",
      "Action": [
        "logs:CreateLogGroup",
        "logs:CreateLogStream",
        "logs:PutLogEvents"
      ],
      "Resource": "arn:aws:logs:*:*:*"
    }
  ]
}
- Wait 5-10 minutes - there's often a delay before logs appear
Problem: Logs appear but custom application logs are missing
Solution:
- Verify your logging configuration is correct in
__init__.py - Check you're using the right log level (INFO vs DEBUG)
- Ensure you're actually calling the logger:
# Make sure you have this in your routes:
application.logger.info("Your log message")
Problem: "No log groups found" in CloudWatch
Solution:
- Check the correct AWS region (must match your EB environment region)
- Look for log group names like:
/aws/elasticbeanstalk/your-env-name/var/log/web.stdout.log - If using custom log group names, verify they're created properly
CloudWatch Logs Insights Query Issues
Problem: Query returns no results despite logs being present
Solution:
- Check the time range - adjust to cover when your logs were generated
- Verify you're searching the correct log group
- Use case-insensitive searches:
fields @timestamp, @message
| filter @message like /(?i)hello/
| sort @timestamp desc
Problem: Query timeout or performance issues
Solution:
- Narrow your time range
- Use more specific filters early in the query
- Limit results appropriately:
fields @timestamp, @message
| filter @timestamp > datefloor(@timestamp, 1h)
| filter @message like "ERROR"
| sort @timestamp desc
| limit 100
Quick Diagnostic Steps
When things aren't working, follow this checklist:
- Verify basic Flask app works - Test locally first
- Check EB deployment logs - Look for deployment errors in EB console
- Confirm log streaming is enabled - Check EB environment configuration
- Test with simple log message - Add a basic log statement and verify it appears
- Check IAM permissions - Ensure EC2 role can write to CloudWatch
- Verify correct AWS region - Logs and EB environment must be in same region
- Wait and refresh - CloudWatch can have 5-10 minute delays
Most logging issues stem from configuration problems rather than code issues, so double-check your EB and CloudWatch settings first.
Cleanup
Simply click on Action -> Terminate environment. You can double check navigate to EC2 service and ensure that there is no running instance.